

If you want to validate our models with your own sensor data please contact us at info@oceanbox.io.
Validation of our model is an ongoing effort and we seek collaboration with everyone that have access to instruments that can be used to validate or correct our simulations. If you are a potential customer and want to check how well our model corresponds to your own observations, please be in touch. We will provide a comparison between observed data and simulations from our model in the same time-period like the one below.
Validation in Gimlingsundet
Conclusion: The model is corresponding very well to observed data in the same location over time.
Example: A comparison of measured current and modeled current at 10m depth in January to Febuary 2023. This validation is from Gimlingsundet (65°12.527 N, 11°58.524 Ø).
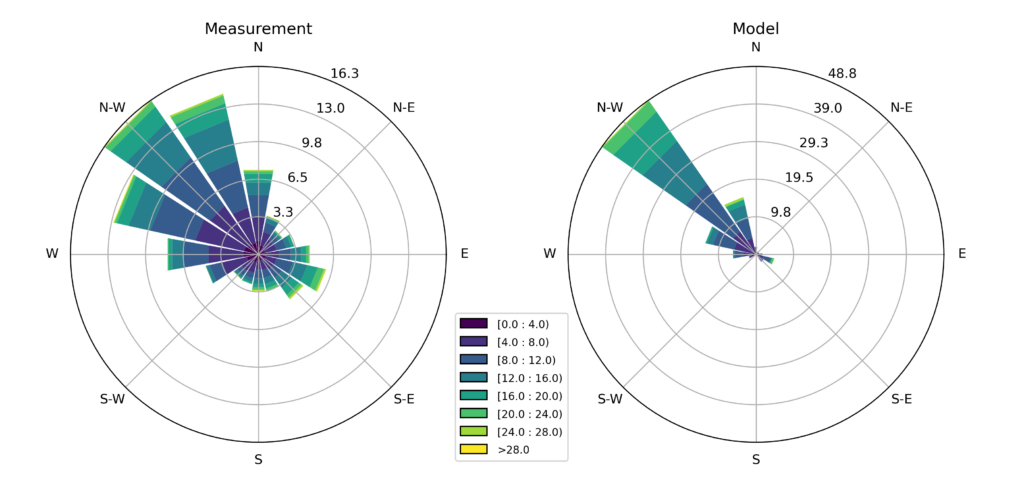
Image 1: Rose histograms showing the distribution of current velocities at 10m depth from measurements (left) and model (right). Each bin shows the distribution in the direction indicated by the orientation of the bin. (Up: northward current, right: eastward, down: southward, left: westward). The length of each bin indicates the proportion of samples (%) occuring in the direction of the bin. The colors show the speed distribution in the corresponding direction. E.g., the more of the color light green in a sector, the more of currents speeds between 24 cm/s and 28 cm/s in that direction.
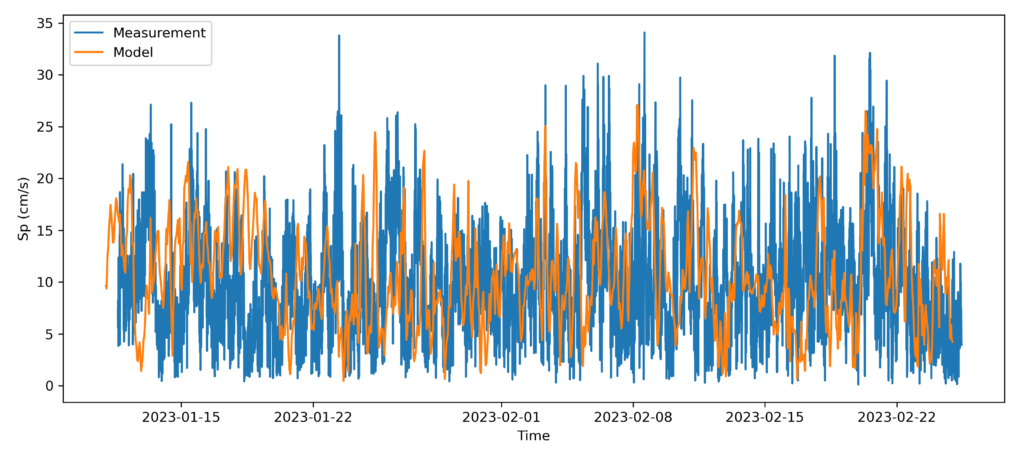
Image 2: Time series of speed at 10m depth from measurements (blue) and model (orange).
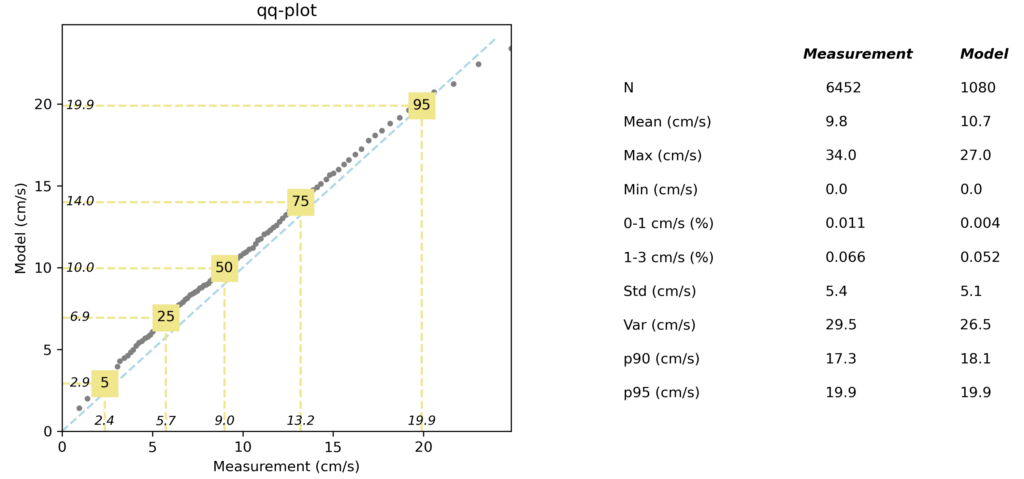
Image 3 (left): Percentiles of measured speed versus Percentiles of modeled speed (grey dots). Squares mark specific percentiles. In this case the 50th percentile (median) was 9 cm/s in the measured data and 10 cm/s in the modeled data.
Image 3 (right): Summary statistics for measured current speed (left column) and modeled current speed (right column).
Please contact us if you want to validate our models with your sensor data